Results and discussion
Table
l
shows a summary of the results from the
current survey compared to the first one from 1977.
In the present survey the effect of a common
calibrator was also modelied by applying the
results ofone ofthe samples, IFCC
l,
to recalculate
the results of the seeond sample, IFCC 2.
As
expected there is an improvement in the
inter-laboratory variation from 1977 to 1993. A
continous change ofmethodology has taken place,
e.g. from single radial immunodiffusion and rocket
immunoelectrophoresis techniques to automated
immunoturbidimetry and immunonephelometry.
Moreover many laboratories have continued to use
the common calibrator used in the Nordkem pro–
tein project. Finaliy national surveys have been
running in several Nordie countries during the last
years.
n
1
o
5
0.6
0.8
1.0
1.2
1.4
g/1
Figl. Histogram showing the results ofsample lFCC-
2 analyzedfor arantitrypsin in 90 Nordiclaboratories.
Most striking, however, is the apparent effect
of the modelied recalibration.
An
example of this
effect is illustrated in Fig
l
and 2, which show the
distribution of the a,-antitrypsin results of the
sample IFCC 2, the original results as weil as the
recalculated ones. The Youden plot on fig 3 shows
that the results ofthe two serumsamples are indeed
correlated, as indicatedby the diagonal distribution
of the results. Thus for most of the proteins studied
the inter-laboratory variation, - mainly due to the
calibration procedure, - accounts for the main part
of the total variation, whereas the intra-laboratory
variation, - mainly coherent with the precision of
the analysis, - only constitutes a minor part.
The results of this study are in agreement with
results from a previous pan-european EQA study
(4) showing that intemal recalibration within an
EQA distribution improved the inter-laboratory
variation.
Klinisk
lcemi i
Norden 4, 1993
n
25
20
15
1
o
5
n
0.8
1.0
1.2
gli
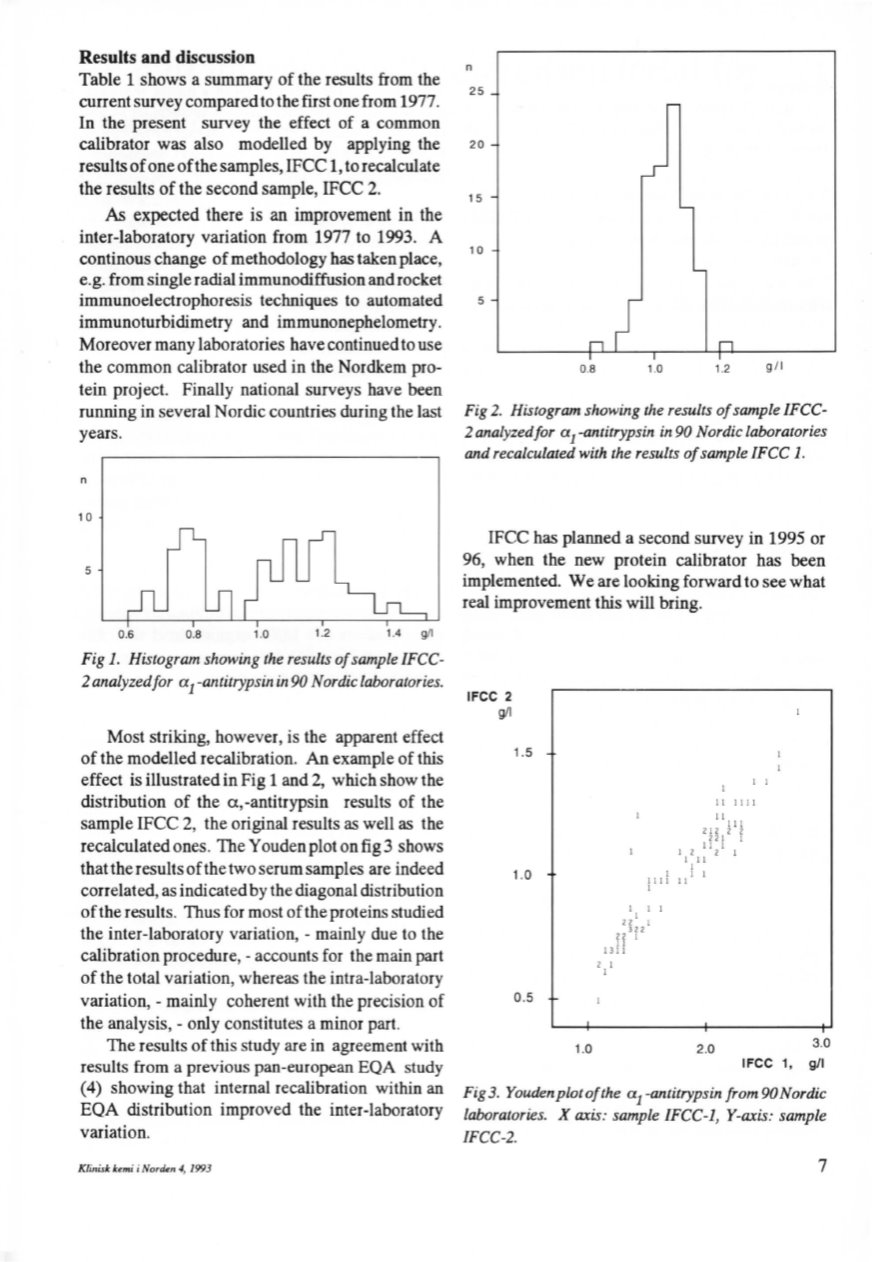
Fig
2.
Histogram showing the resulls ofsample lFCC-
2 analyzedfor a
1
-antitrypsin in 90 Nordiclaboratories
and recalculated with the results ofsample lFCC l .
IFCC has planned a seeond survey in 1995 or
96, when the new protein calibrator has been
implemented. We are Jooking forward to see what
real improvement this will bring.
IFCC 2
g/1
1.5
1.0
0.5
1.0
l l
Il 1111
Il
212
!'!
221
l
III
l 2
2
l
III
l
l
l l
1111 Il
l
l
l l
l
12
l
312
22
l
Il
1311
z
l
l
2.0
3.0
IFCC
1,
g/1
Fig 3. Youdenplotofthe a
1
-antitrypsin from 90Nordic
laboratories. X axis: sample lFCC-1, Y-axis: sample
lFCC-2.
7


