B. Intemal factors:
a. Calibration function (choise of the func–
tion of reproducibility)
b. Within-run and between-run reprodu–
cibility
c. Influence of turbidity in samples on the
measurements.
Local Calibrator
Control samples
o.o
2.0
2.5
g/L
The four control samples are designed and pro–
duced for the mentioned purposes (Fig. 3). An
untreated serum pool (Control T) is the basis
for the system. Parts of this pool are cleared by
ultracentrifugation and adjusted to volumes by
clear infranatant giving concentrations of 0.5,
LO and 1.5 of the original concentrations for the
nine proteins.
CONTROL OF QUALITY
CONTROL B
(=
1.s•coNTROL A)
l
(CLEAR)
CONTROL T
---
CONTROL A
(=
CONTROL T)
(TURBID)
l
(CLEAR)
CONTROL C
(=
o.s•coNTROL A)
(CLEAR)
Fig. 3 The four contro/ samples with weil defined re–
lationships between allsamples (from Uppsala
J
Med
Sci 1990;95:251-5, with permission)
Theory and resnits for the use of control
samples
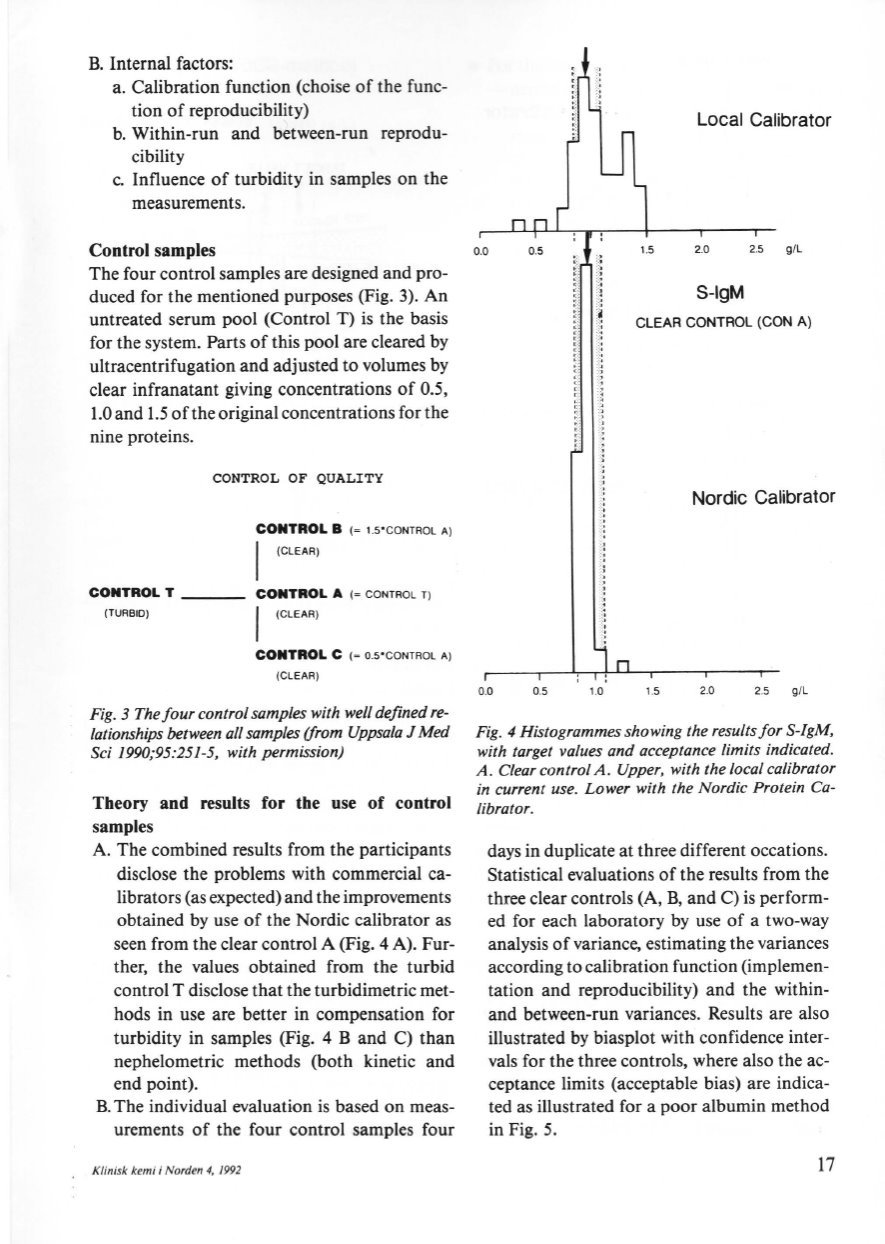
A. The combined results from the partidpants
disclose the problems with commercial ca–
librators (as expected) and the improvements
obtained by use of the Nordie calibrator as
seen from the clear control A (Fig. 4 A). Fur–
ther, the values obtained from the turbid
control T disclose that the turbidimetric met–
hods in use are better in compensation for
turbidity in samples (Fig. 4 B and
C)
than
nephelometric methods (both kinetic and
end point).
B. The individual evaluation is based on meas–
urements of the four control samples four
Klinisk kemi
i
Norden 4, 1992
;:::
S-lgM
f
CLEAR CONTROL (CON A)
t::·
,.
•::
:
~
:.~
·:·
.,
::,
:~
,.
"·l
[:
·,
'
'
.-l
Nordie Calibrator
o.o
0.5
1.0
1.5
2.0
2.5
g/L
Fig. 4 Histogrammes showing the resulls for S-IgM,
with target va/ues and acceptance limits indicated.
A. C/ear contro/ A. Upper, with the /ocal calibrator
in current use. Lower with the Nordie Protein Ca–
/ibrator.
daysin duplicate at three different occations.
Statistical evaluations of the results from the
three clear controls (A, B, and
C)
is perform–
ed for each laboratory by use of a two-way
analysis of variance, estimating the variances
according to calibration function (implemen–
tation and reproducibility) and the within–
and between-run variances. Results are also
illustrated by biasplot with confidence inter–
vals for the three controls, where also the ac–
ceptance limits (acceptable bias) are indica–
ted as illustrated for a poor albumin method
in Fig. 5.
17


