Klinisk Biokemi i Norden · 1 2015
| 43
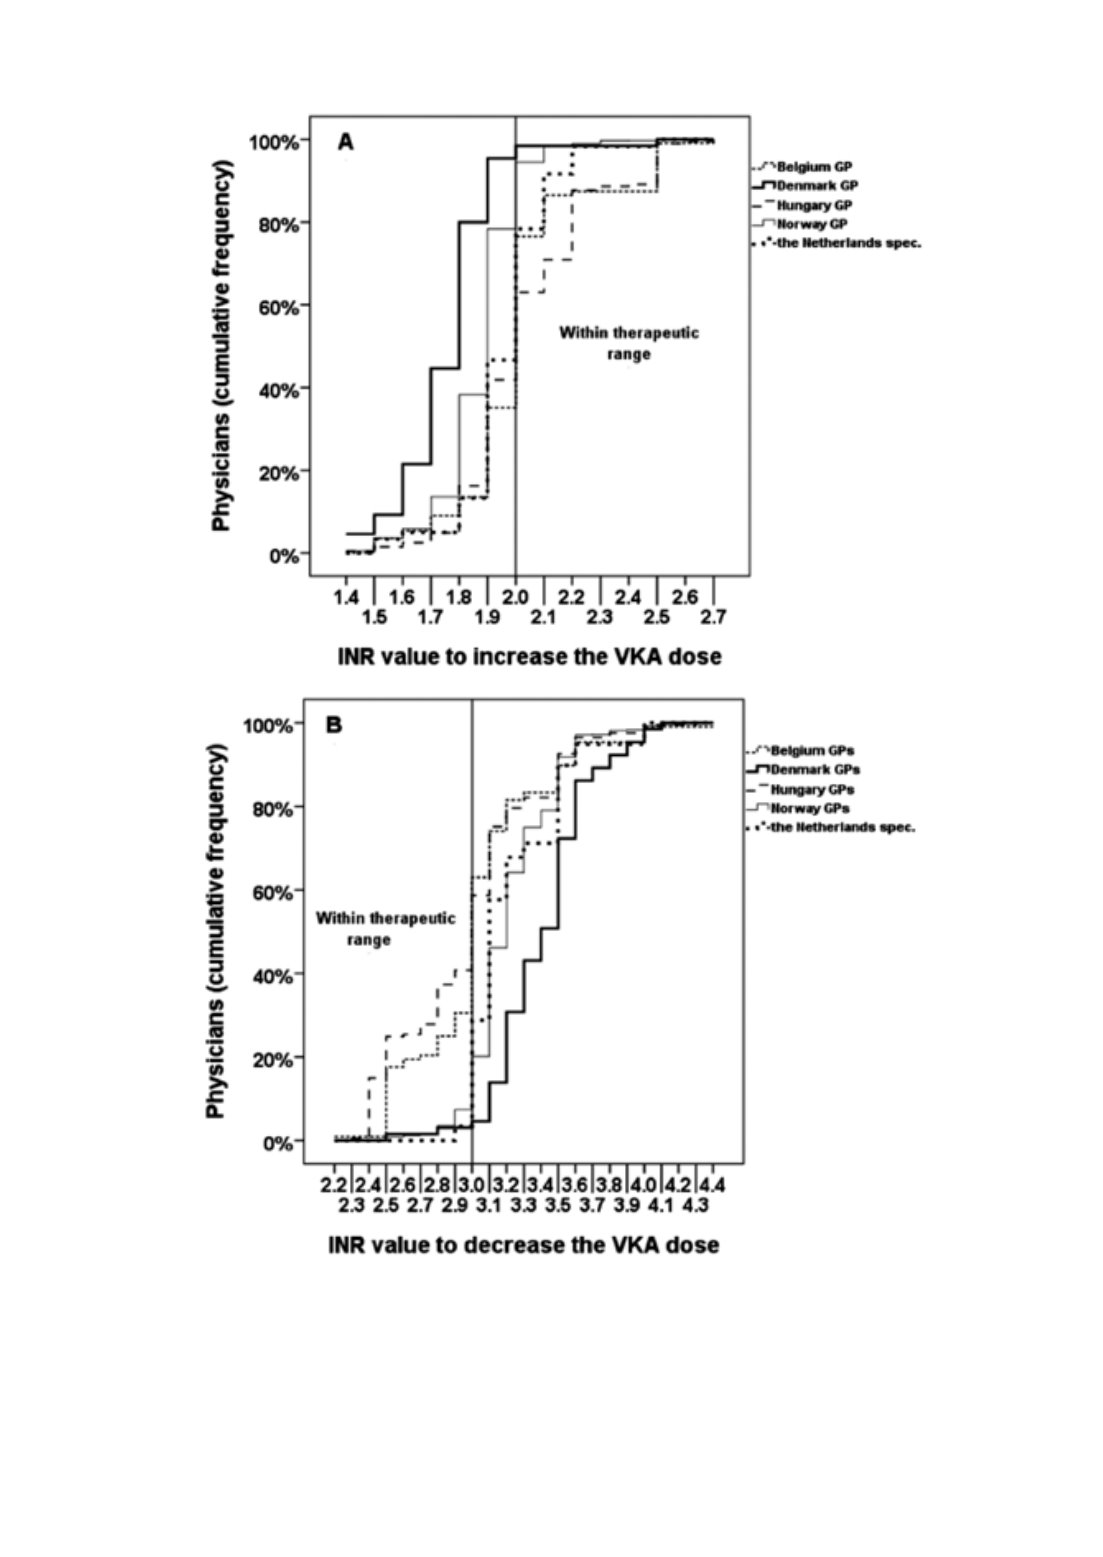
Figure 1.
Patient A with atrial fibrillation in paper II; Physicians increasing (A) or decreasing (B) the VKA dose at different
INR values. The countries omitted from the figures would have been represented with lines inbetween these results. The ver-
tical lines represent the lower (A) and upper (B) therapeutic limits. GP = general practitioners, spec. = specialists (secondary
care). Reprinted from Kristoffersen AH et al. Interpretation and management of INR results: A case history based survey in
13 countries. Thromb Res 2012;130:309-15, with permission from Elsevier.


