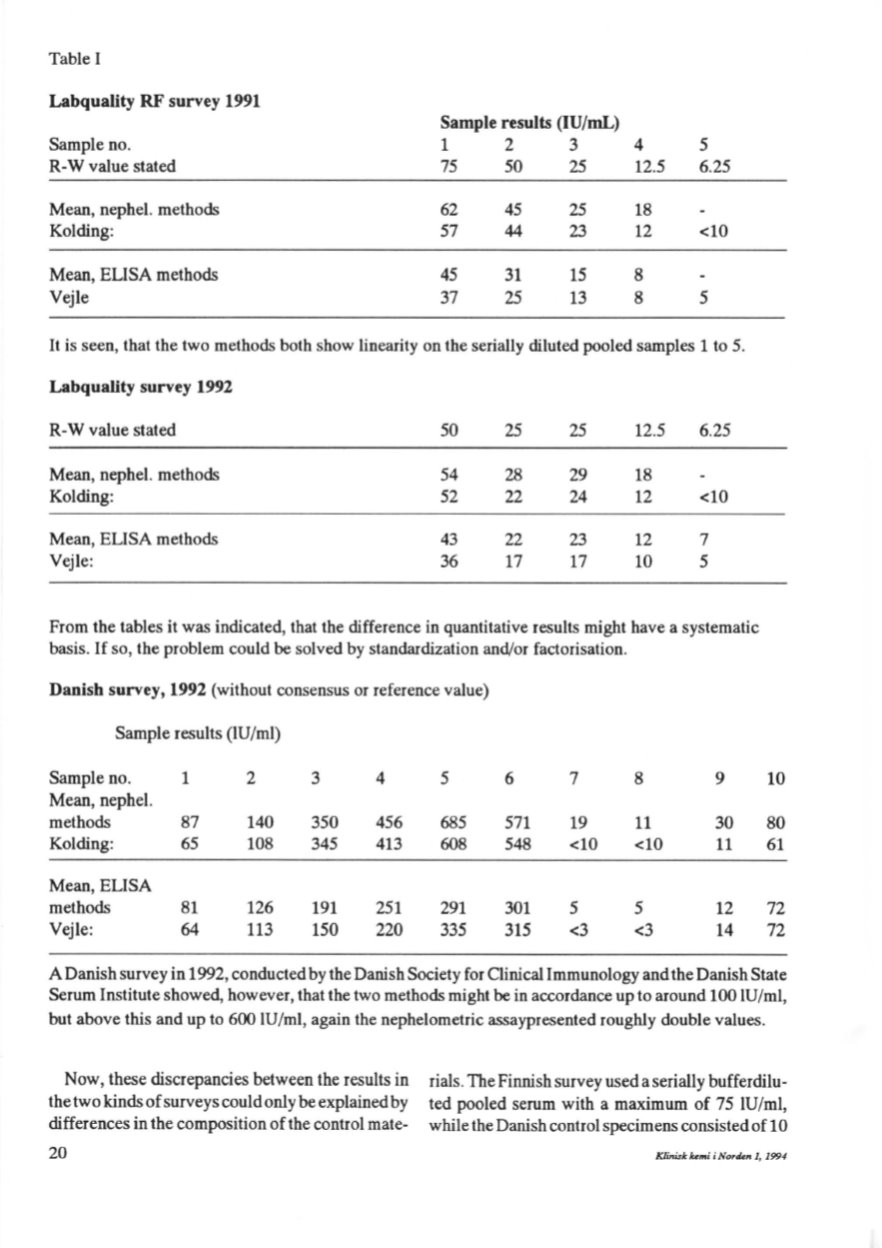
Table I
Labquality RF survey 1991
Sample results
(IU/mL)
Sample no.
l
2
3
4
5
R-W value stated
75
50
25
12.5
6.25
Mean, nephel. methods
62
45
25
18
Kolding:
57
44
23
12
<10
Mean, ELISA methods
45
31
15
8
Vej le
37
25
13
8
5
It
is seen, that the two methods both show linearity on the serially diluted pooledsamples
l
to 5.
Labquality survey 1992
R-W value stated
50
25
25
12.5
6.25
Mean, nephel. methods
54
28
29
18
Kolding:
52
22
24
12
<lO
Mean, ELISA methods
43
22
23
12
7
Vej le:
36
17
17
10
5
From thetablesit was indicated, that the difference in quantitative results might have a systematic
basis.
If
so, the problem could be solved by standardization and/or factorisation.
Danish survey, 1992 (without consensus or reference value)
Sample results (IU/ml)
Sample no.
l
2
3
4
5
6
7
8
9
10
Mean, nephel.
methods
87
140
350
456
685
571
19
11
30
80
Kolding:
65
108
345
413
608
548
<lO
<10
11
61
Mean, ELISA
methods
81
126
191
251
291
301
5
5
12
72
Vej le:
64
113
150
220
335
315
<3
<3
14
72
A Danish survey in
1992,
conducted by the Danish Society for Clinical Immunology and the Danish State
Serum Institute showed, however, that the two methods might be in accordance up to around
100
IU/ml,
but above this and up to 600 IU/ml, again the nephelometric assaypresented roughly double values.
Now, these diserepaodes between the results in
the two kinds ofsurveys could only be explainedby
differences in the composition of the control mate-
20
rials. The Finnish survey used a serially bufferdilu–
ted pooled serum with a maximum of
75
IU/ml,
while the Danish control specimens consisted of
lO
Klinis/cUmi
i
NortUn 1, 1994


