Klinisk Biokemi i Norden · 2 2016
| 21
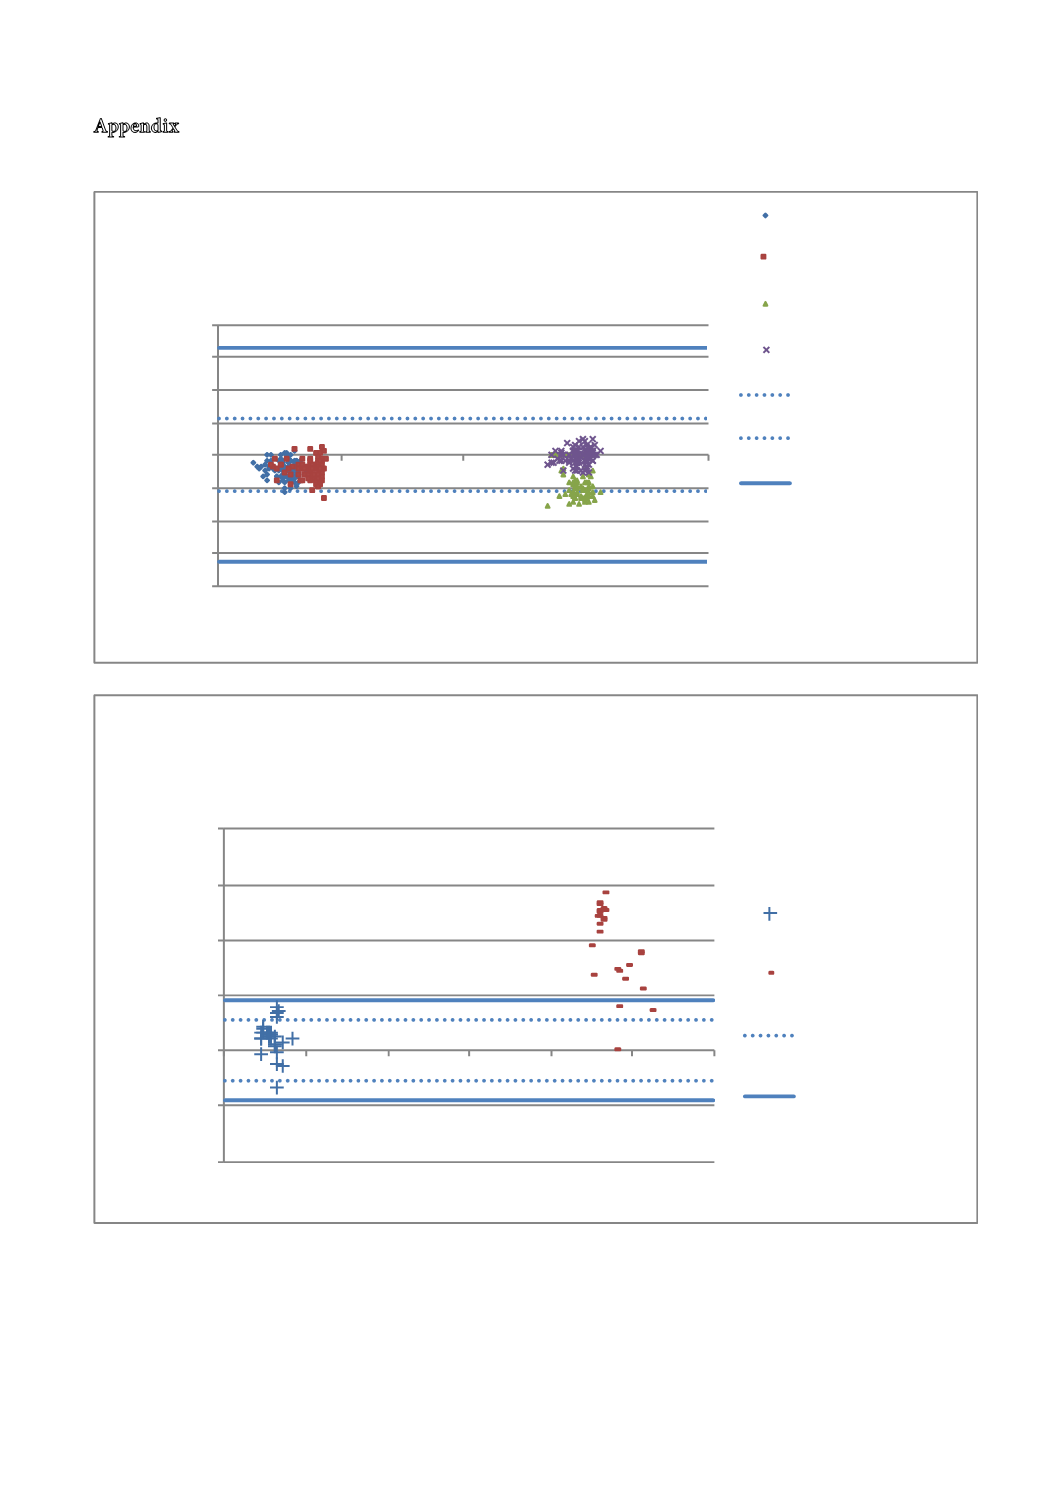
-20
-15
-10
-5
0
5
10
15
20
0
10
20
30
40
Relative difference
between tubes and
"O-sample" (%)
time between analysing "0-sample" and the tube 2 -5
(h)
Ca-ionized (pH7.4)
Tube 2
Tube 3
Tube 4
Tube 5
Expected analytical
variation
Serie6
Allowable deviation
Tube 5 was centrifuged at the
same time as tube 1, but sent
by the first transport next day.
-10,00
-5,00
0,00
5,00
10,00
15,00
20,00
0
5
10
15
20
25
30
Relative difference.
6 and
24 h -
arrival
1. sample (%)
time from arrival of 1. sample to arrival of 2. ad 3. sample
B-(Erys)MCV
2. sample
3. sample
Expected analytical
variation
Allowed deviation
Appendix
Examples of relative difference plots.
-(Erythr) M V
Ca-ioni
(
.4)


