Klinisk Biokemi i Norden · 1 2013
| 35
the native samples only) was performed with Micro-
soft Excel® 2002 (Redmund, WA, USA). Afterwards,
it was investigated whether the peer group results
for the EQA samples were within the 95% prediction
interval of the regression line at the concentrations of
the EQA samples (= the EP14-A2 approach). Instead
of plotting the data for the commutability assessment
in a scatter diagram, we presented them in a % dif-
ference plot. For the EQA samples, we calculated the
deviation (%), at their respective concentrations, from
the regression line for the native samples. For S-Ca
and the typical imprecision of measurement (median
CV), we calculated the number of replicates needed
to obtain the magnitude of the prediction interval
(%) observed in this study. We also compared the
observed prediction interval with the one that would
be obtained according to the typical EP14-A2 protocol
recommending 3 measurements, only. For S-Mg, more
in particular the Abbott Architect case with 4 labora-
tories performing duplicate measurements with a peer
group specific median CV, we calculated the expected
magnitude of the prediction interval (%), if only the
measurement variance would be the input parameter.
From comparison of this calculated prediction interval
(%) with the one observed in the study, we derived the
impact of sample-related effects. In all calculations, we
considered the prediction interval to be approximately
double the Sy/x (i.e. standard deviation of the regres-
sion residuals) (%) of the regression analysis, which is
representative for the expected variation in a method
comparison due to the measurement imprecision.
Results
The prediction intervals (%) at the mean of the con-
centration range for native samples were ≤0.5% for
S-Ca and ≤0.7% for S-Prot (except that for the Ortho
Vitros system = 1.8%). For S-Mg and S-Alb they were
wider (0.6 – 1.3%) and even broad for the Abbott
Architect - (S-Mg: 3.5%, S-Alb: 3.2%), Siemens Advia
- (S-Alb: 3.1%), and Ortho Vitros assay (S-Mg: 2.0%,
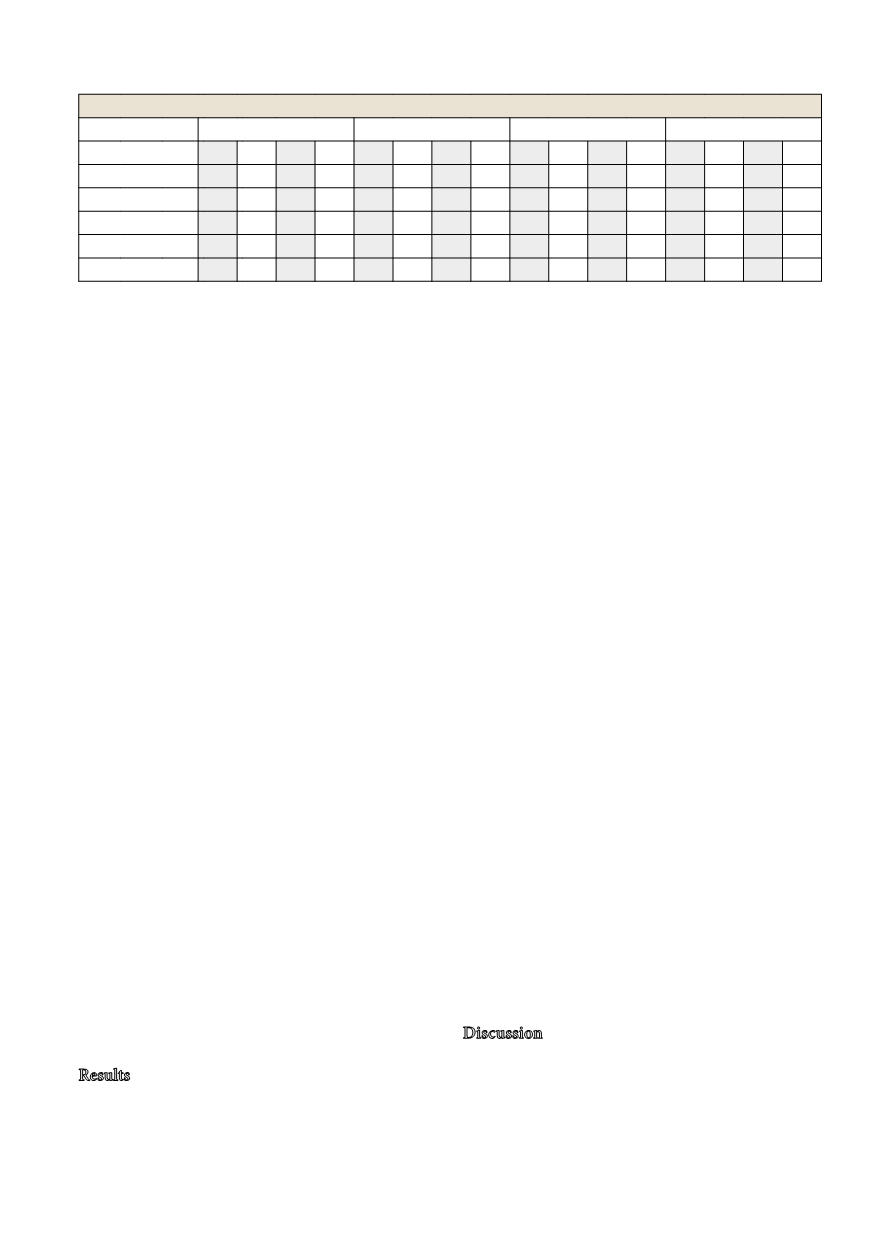
S-Alb: 2.1%). Table 1 presents for each of the analytes
and peer groups the prediction intervals (%) at the
concentrations of EQA sample #1 and #2, as well as
the deviation (%) of the latter from the regression
line. The median CVs calculated form all measure-
ments were 1.0% (S-Ca), 2.0% (S-Mg), 1.2% (S-Alb)
and 1.0 % (S-Prot). The EQA materials #1 and #2
were considered commutable when their deviation
from the regression line was within the prediction
intervals at their respective concentrations (= “ok”
in Table 1) (see also Fig. 1, for an example of a grap-
hical presentation of the commutability assessment).
EQA material #1 was generally commutable, or has
a deviation bigger than the prediction interval at its
concentration that is not considered significant (0.5%
to 0.8%). EQA material #2 showed non-commutabi-
lity for the Abbott Architect S-Ca assay (deviation of
1.4% is bigger than the prediction interval of 1.1%),
the Abbott Architect-, Ortho Vitros- and Siemens
Advia S-Mg assays (deviations of 5.0%, 5.4% and
2.5% versus prediction intervals of 4.6%, 2.6% and
1.8%, respectively), and the Abbott Architect and
Ortho Vitros S-Alb assays (deviations of 5.1% and
7.2% versus 4.5% and 2.9%, respectively).
Discussion
In general, this study demonstrates the utility of
an EQA survey with native sera for commutability
assessment. For obvious reasons, it provides a consi-
derably higher number of measurements than in the
Table 1 Prediction intervals (%) and commutability data ($) for the EQA sera #1 & #2
Calcium
Magnesium
Albumin
t-Protein
PI#1 #1 PI#2 #2 PI#1 #1 PI#2 #2 PI#1 #1 PI#2 #2 PI#1 #1 PI#2 #2
Abbott Architect
0.4 0.6 1.1 1.4 3.4 ok£ 4.6 5.0 3.1 ok 4.5 5.1 0.6 0.7 1.0 ok
Ortho Vitros
0.5 ok 1.3 ok 2.0 ok 2.6 5.4 2.0 ok 2.9 7.2 1.7 ok 2.6 ok
Roche Modular
0.5 0.5 1.1 ok 0.6 0.6 0.8 ok 0.8 ok 1.2 ok 0.5 ok 0.8 ok
Roche Cobas
0.3 0.3 0.7 ok 1.1 ok 1.5 ok 0.9 ok 1.3 ok 0.6 ok 1.0 ok
Siemens Advia
0.4 0.4 0.9 ok 1.3 ok 1.8 2.5 2.9 ok 4.3 ok 0.5 0.6 0.8 0.8
$For each EQA sample the deviation (%) from the regression line for the native samples was calculated.
PI#1, PI#2: prediction interval (%) at the concentration of EQA sample #1 and #2.
£ok: EQA material is commutable, because its deviation is smaller than the prediction interval.


