Klinisk Biokemi i Norden · 1 2013
| 33
cannot compare biases among routine methods wit-
hout prior commutability assessment of the samples.
The observed biases indeed may not be genuine but
an artifact in the comparison caused by matrix effects
of the materials (1-3). Assessment of commutability
can be done by a variety of experimental protocols
and statistical approaches for interpreting the results
(4). However, in all of them, the decision strongly
depends on the variance observed for the native
samples. The latter comprises two components, i.e.,
the measurement variance and the variance due to
random sample-related effects (5, 6). Unfortunately,
in most of the reported commutability studies, little
attention is paid to the magnitude of the sample vari-
ance, despite the fact that it may be rather large. For
example, the cholesterol data, described in the EP14-
A2 document, result in a prediction interval of ±4%
(7). All samples within this interval are considered
commutable, even though they exceed the recom-
mended 3% bias limit for cholesterol procedures (8).
In commutability studies for creatinine, prediction
intervals ≥15% were reported (9). Again, these are
far too wide to make decisions about acceptability of
the traceability of routine measurement procedures
to mass spectrometry-defined target values (note: the
bias limit set in the creatinine standardization study
is 8%). Both examples clearly indicate that sample
variances need to be reduced in many cases to allow
meaningful decisions about commutability. It has
been shown that reduction of sample variance can be
achieved by virtual pooling of samples and increasing
the number of measurement replicates (5, 6).
Here, we investigated the utility of a special Norsk
Klinisk-kjemisk Kvalitetssikring (NKK) EQA survey
with 20 native sera for commutability assessment of
2 control materials intended for the assessment of
measurement procedures for serum-calcium (S-Ca),
-magnesium (S-Mg), -albumin (S-Alb), and -protein
(S-Prot). We studied the effect of the high number
of measurements achieved through the EQA survey
on the magnitude of the prediction intervals used in
the statistics for commutability assessment. We also
evaluated the impact of sample-related effects.
Materials and methods
Samples
A panel of 20 single-donation sera from Solomon
Park Research Laboratories (Kirkland, WA, USA)
was used. Blood collection and preparation of serum
(approximately 160 mL per unit) was done using
the CLSI C37-A protocol, however, without filtra-
tion and with addition of human thrombin (from
Sigma-Aldrich, 2 U/mL plasma), to ensure clotting
within 3 hours at room temperature (CLSI C37-A)
(10). The serum of each donation was assessed and
found negative in the usual serological testing (HIV,
HBsAG, HCV and Rapid Plasma Reagin). Samples
were aliquoted (1 mL), frozen and stored at -70°C.
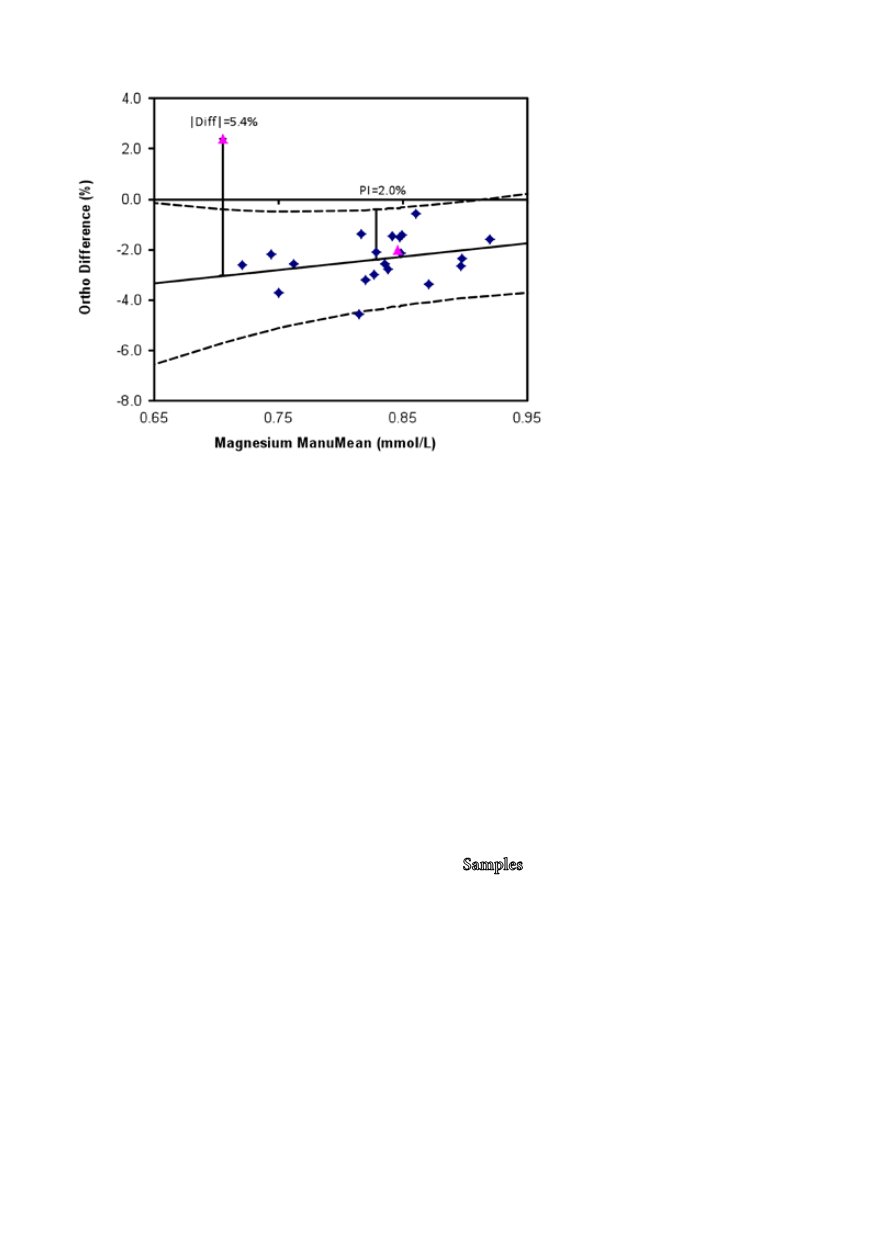
Figure 1:
Graphical presentation of the com-
mutability data for the Ortho Vitros S-Mg
assay. The long broken lines represent the
prediction interval, the pink triangles EQA
sample #1 (concentration: 0.9 mmol/L) and
#2 (0.7 mmol/L). The two bars refer to the
prediction interval at the mean of the concen-
tration range covered by the native samples
(PI = 2%) and the deviation of EQA sample
#2 from the regression line (5.4%). The pre-
diction intervals at the concentrations of the
EQA samples were 2.0% (0.9 mmol/L) and
2.6% (0.7 mmol/L), respectively.


