Klinisk Biokemi i Norden · 1 2017
| 13
Full diagnostic validation
Full diagnostic validation
is used for establishing the
diagnostic properties of the method in health and
disease (32-34). It is a major research undertaking
demanding that the diagnosis in question is inde-
pendently established by other methods than the one
being tested. It is usually performed by a research
team using a single measurement system in order to
reduce measurement uncertainty. In contrast, when
the method is used in real-life healthcare circum-
stances, sample from the same patient are likely to
encounter several measurement systems with bias and
imprecision profiles substantially different from the
ones encountered during the original full diagnostic
validation study. These properties are commonly
more unfavourable regarding diagnostic properties.
Galen and Gambino (35) pioneered in establishing
the statistical and epidemiological principles of full
diagnostic method validation and showed that “com-
mon sense” interpretation of data prevalent in clinical
medicine should be replaced by rational principles.
Recent excellent literature in the field includes the
books by Pepe (36) and Zhou et al. (37).
The basis of characterizing diagnostic performance
is to have a well-accepted gold standard for the diag-
nosis and estimating how well the diagnostic method
being validated performs in relation to the gold stan-
dard method. Data are depicted in a classical 2x2 table
(Figure 7) and the parameters/concepts depicted and
defined in table 1 are calculated.
Diagnostic validation in conglomerates of laboratories
Diagnostic validation in conglomerates of laborato-
ries
investigates to what extent a conglomerate of
measurement systems that samples from a patient
are likely to encounter can reproduce the conditions
that existed during the original full diagnostic vali-
dation. Included in the diagnostic validation are also
estimates of the pre- and postanalytical errors which
are encountered using systems for registering the inci-
dence of non-conformance. The author is not aware of
any reported full diagnostic validation of a conglome-
Participants
With disease
Without disease
Positive test
True positives
False positives (type I error)
Total positive [PPV]
Negative test
False negatives (type II error)
True negatives
Total negative [NPV]
Total with disease
Total without disease
[Sensitivity]
[Specificity]
Figure 6:
A 2x2 table serving as basis for calculating sensitivity, specificity, predictive values and likelihood ratios (Table 1).
PPV = positive predictive value, NPV=negative predictive value.
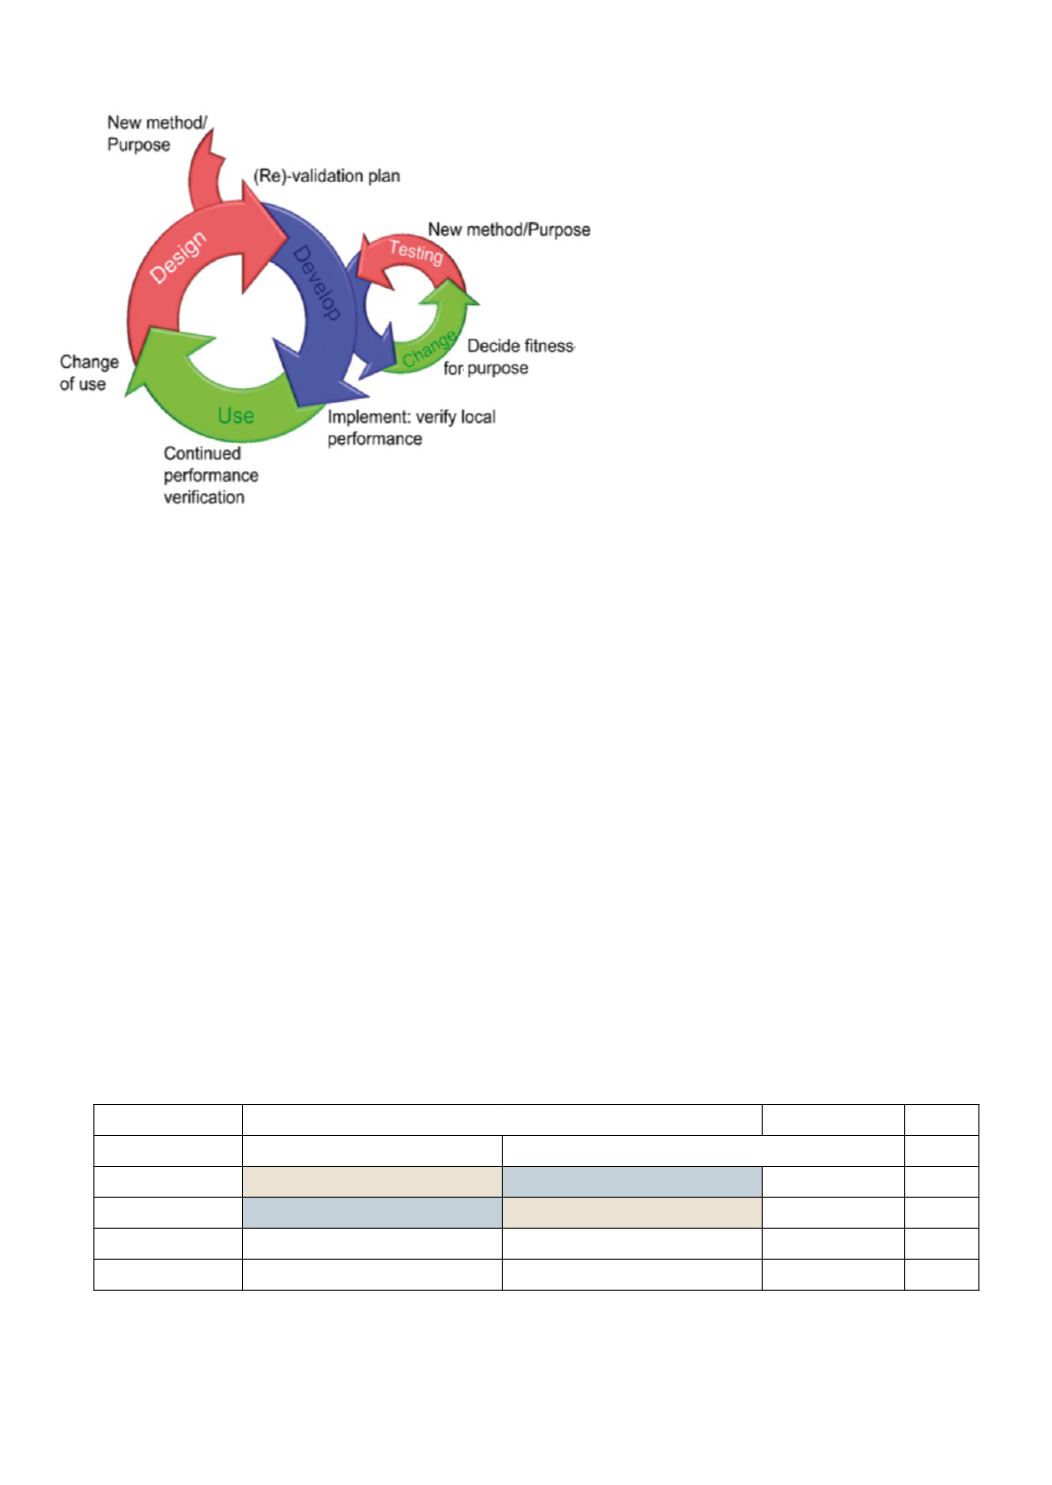
Figure 5
: The sub-processes of method validation.
Subsequent to receiving a proposal for a new met-
hod a process of method design, followed by method
development takes place. The development process in
itself is also an iterative process of testing and change
(shown to the right) in order to optimize the fitness
for purpose of the method. Continuted performance
testing during the use of the method in practical situ-
ations may show need for improvements that subse-
quently serve as input in a new design process which
serves as bases for a new development cycle. Such new
cycle is also warranted when the method is put to use
in new circumstances. Redrawn figure. Copyright ©
2007 LGC Limited – All Rights reserved. Material
reproduced from ‘Method Validation: Principles and
Practice’ seminar (September 2007) by permission of
LGC Limited. No part of this material may be repro-
duced without LGC Limited’s express consent.


