Klinisk Biokemi i Norden · 1 2017
| 11
Ortogonal regression/Deming graph
In ordinal regression commonly available in statisti-
cal packages MS Excel etc., all the error are taken to be
found in the data on the Y-axis (in the vertical direc-
tion) (Figure 3). The regression line is drawn in order
to minimize the sum of squared distance from the
data points to the regression line in the vertical direc-
tion. This method makes for convenient formulas for
calculation, but is only fully appropriate in method
comparison studies when the method plotted on the
X-axis is substantially metrologically superior to the
method plotted on the Y-axis, e.g. when comparing a
routine method to isotope-dilution masspectrometry.
Whan comparing an old method (plotted on the
X-axis) with a new method (plotted on the Y-axis)
there are ample reasons to suppose that the new
method is at least as accurate as the old method. It
is therefore reasonable to use orthogonal regression
which supposes that the errors occur in both the old
and in the new method.
Simple Deming
Regression
fredag, november 04, 2016, 10:26:16
Data Source: Data 1 in Metodjämförelse
X-data: 1-A
Y-data: 2-B
Standard deviation for each X-measurement: 1,0000
Standard deviation for each Y-measurement: 1,0000
Number of observations. . . . . . . . . . . . 20
Number missing . . . . . . . . . . . . . . . .0
Data correlation coefficient. . . . . . . . .0,9967
Chi-square statistic. . . . . . . . . . . . 0,0710
Reduced chi-square. . . . . . . . . . . . 0,0039
Degrees of freedom. . . . . . . . . . . . . . 18
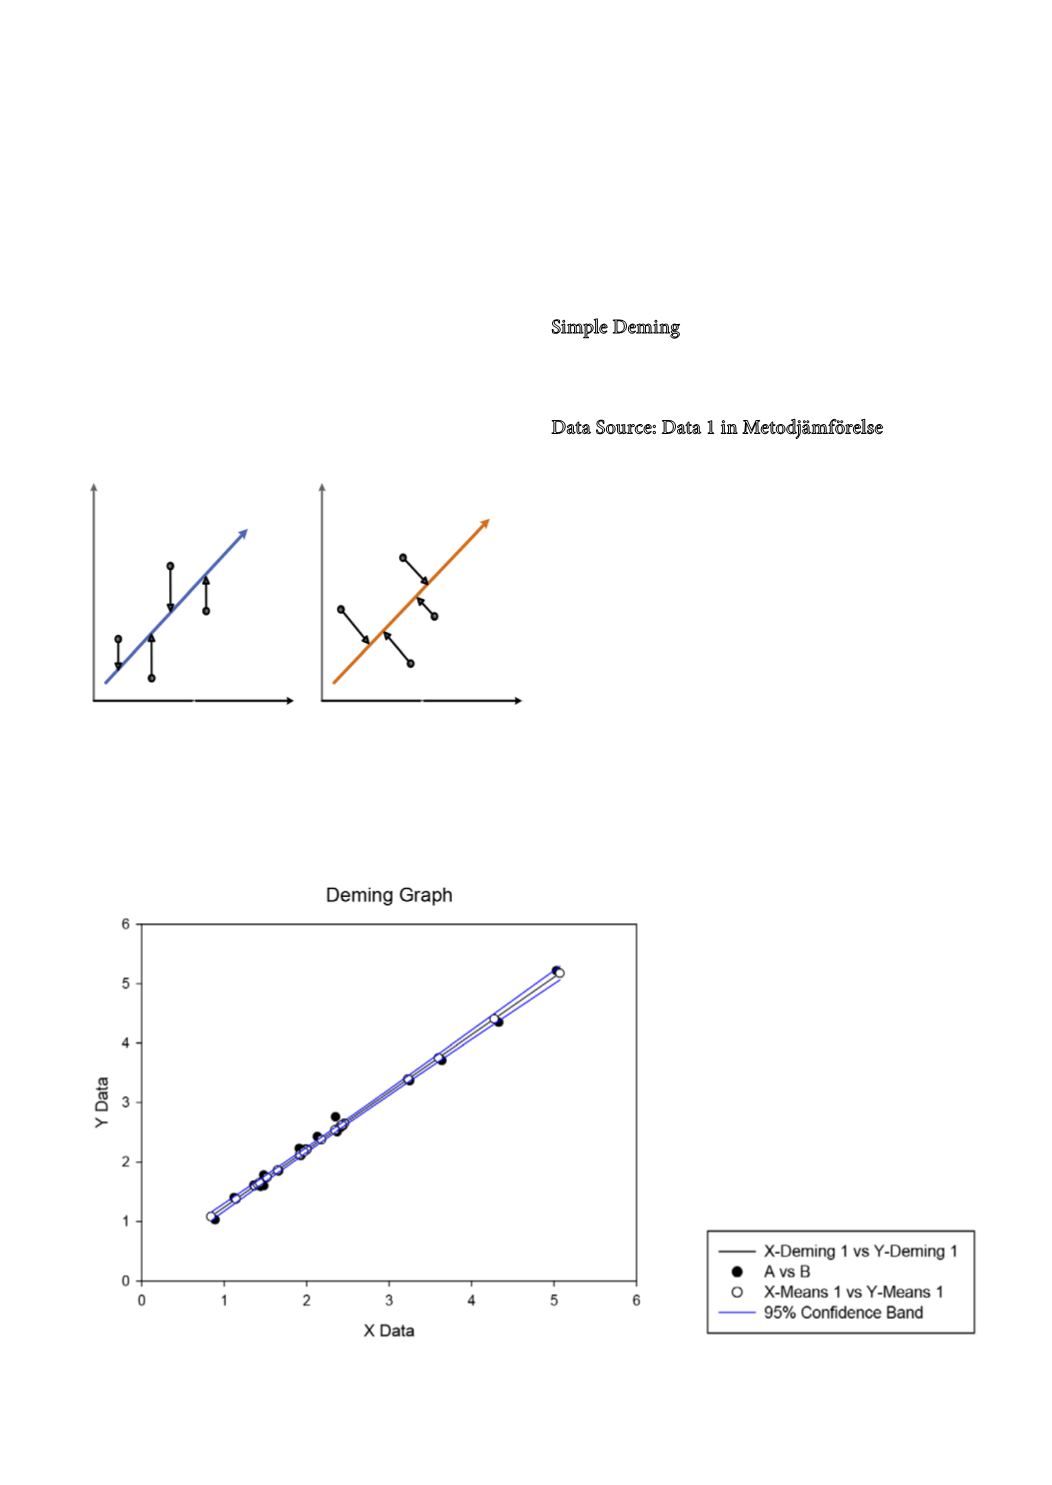
Figure 3
: The basic principles of ordinary linear regression
(A) compared to orthogonal/Deming regression (B). The
sum of squared distances in the vertical direction is mini-
mized in the ordinary linear regression (A) whereas the sum
of the squared distances perpendicular to the regression line
(B) is minimized in orthogonal/Deming regression.
Figure 4
: Ortogonal/Deming regres-
sion of the data in table 1 (solid dots )
created by Sigma plot 12.5
A
B


