Klinisk Biokemi i Norden · 3 2017
| 33
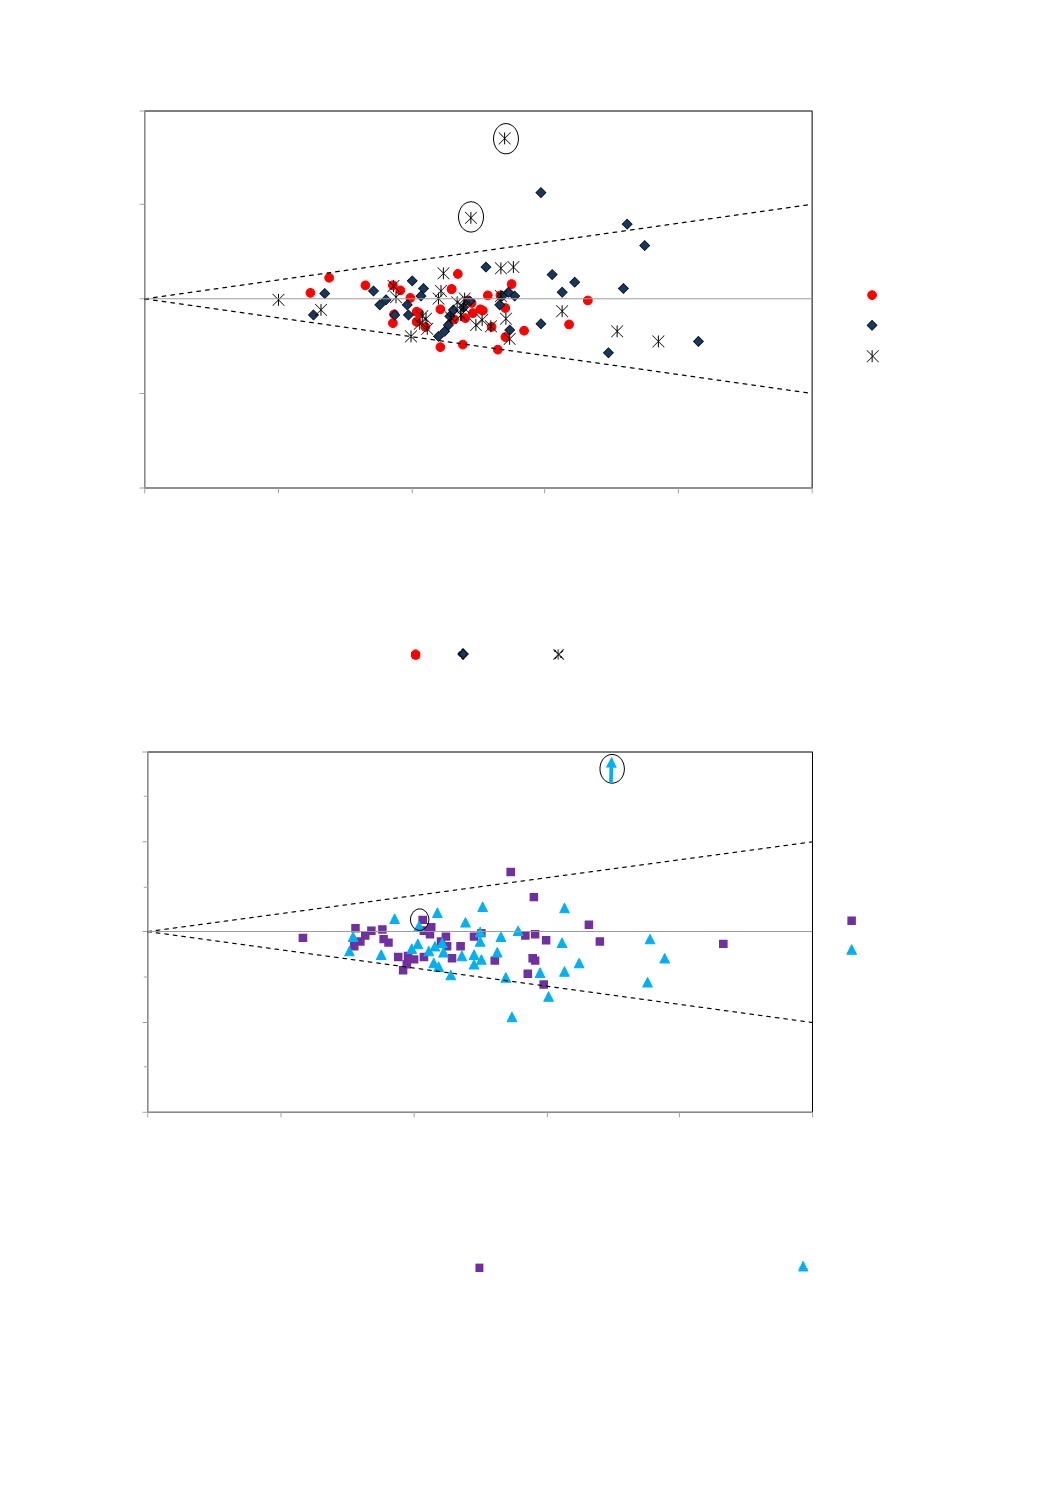
Figure 3. Accuracy of PT (INR) results on Xprecia Stride achieved by intended users. The x-axis represents the mean PT
(INR) result of the comparison method. The y-axis represents the PT (INR) deviation in INR of the first capillary sam-
ple measurement on Xprecia Stride from the mean result of the corresponding sample of the comparison method. The
results from PHCC1 are represented with the symbol ( ) and results from PHCC2 with the symbol ( ). Stippled lines
represent allowable deviation limits of ±20%. Number of results (n) = 78. ID 224 and ID 132, statistical outliers from
the calculations of repeatability and bias respectively, are illustrated with a circle around the symbol. ID 224 is marked
with an arrow as the result is outside the plot.
Figure 2. Accuracy of PT (INR) results on Xprecia Stride under optimal conditions. The x-axis represents the mean PT
(INR) result of the comparison method. The y-axis represents the PT (INR) deviation in INR of the first capillary sample
measurement on Xprecia Stride from the mean result of the corresponding sample of the comparison method. The diffe-
rent lots of test strips are illustrated as lot a ( ), b ( ) and lot c ( ). Stippled lines represent allowable deviation limits of
±20%. Number of results (n) = 100. ID 14 and ID 37, statistical outliers from the calculations of repeatability and bias
respectively, are illustrated with a circle around the symbol.
-2
-1
0
1
2
0
1
2
3
4
5
Deviation Xprecia Stride, INR
Comparison method, INR
Lot a
Lot b
Lot c
+20%
-20%
Deviation for:
-2
-1
0
1
2
0
1
2
3
4
5
Deviation Xprecia Stride, INR
Comparison method, INR
PHCC1
PHCC2
+20%
-20%
Deviation for:


