Klinisk Biokemi i Norden · 2 2016
| 17
Table 2a shows how many samples fulfill the demand on allowed deviation. Calcium-ion (pH 7.4), Prostate
specific antigens fulfill the demand for all tubes (2 – 5). Parathyroid hormone fulfills for the tubes 2, 3 and 5
and Proinsulin-C-Peptide does not fulfill for any of tubes.
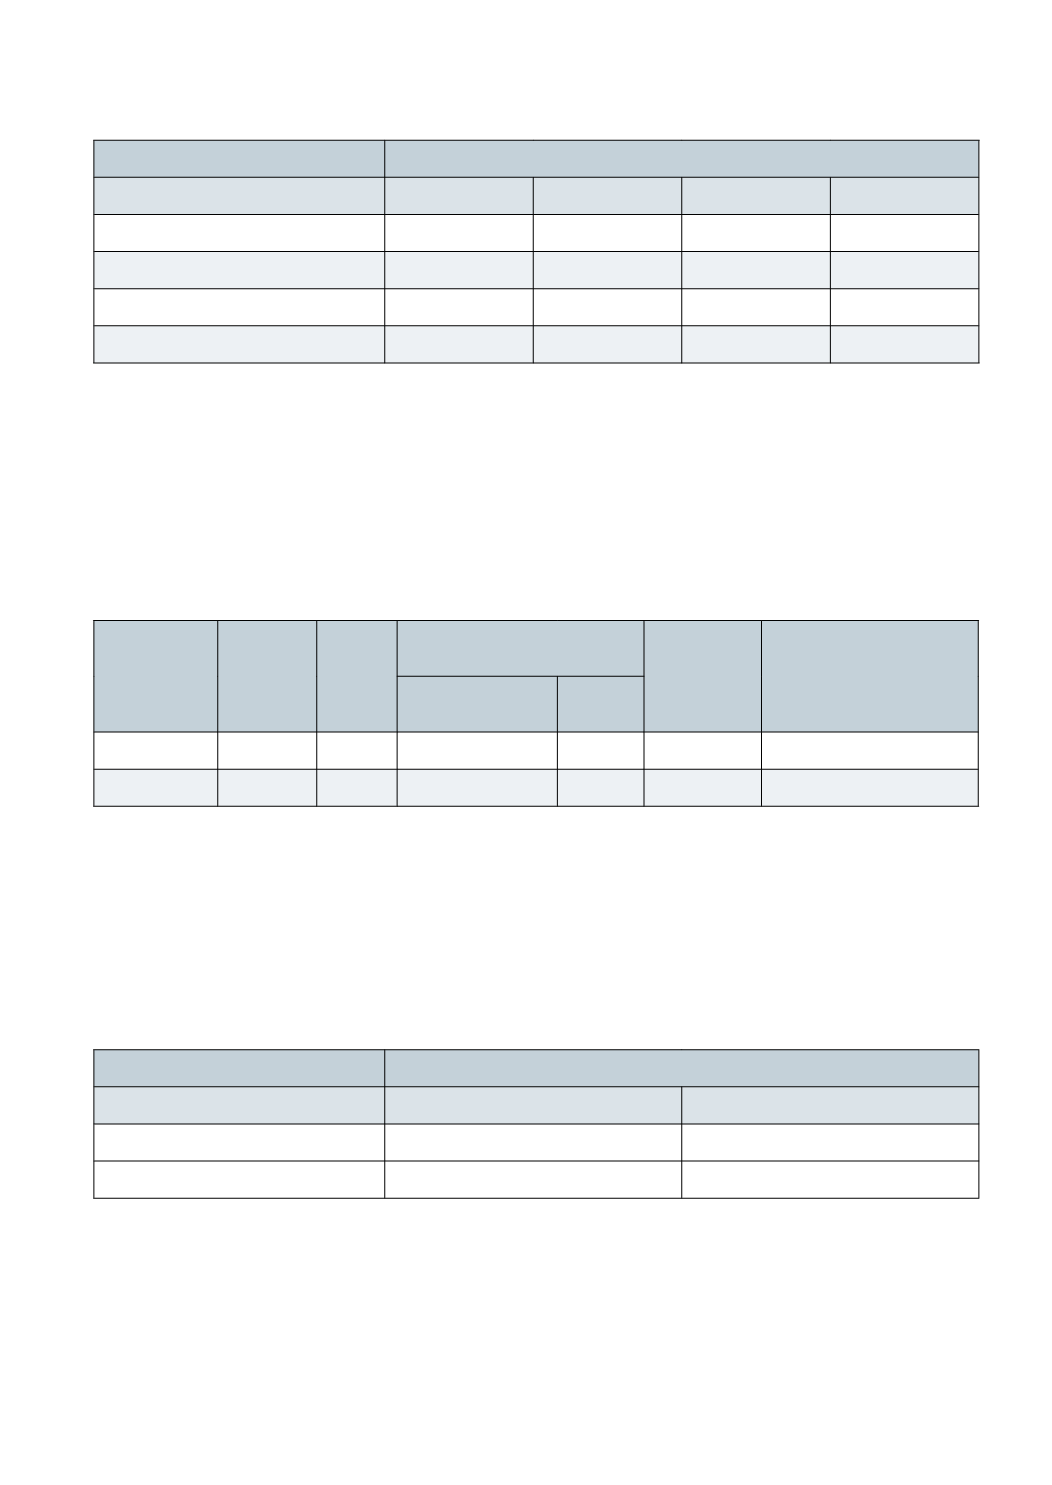
Table 2a. No of results which fulfill the goals.
Component
No. of results which fulfill the demand on allowed deviation (%)
Tube 2
Tube 3
Tube 4
Tube 5
Calcium, ionized (pH 7,4), mmol/l
100.0
100.0
100.0
100.0
Prostate specific antigen, µg/l
100.0
100.0
100.0
100.0
Parathyroid hormone, pmol/l
98.0
98.0
93.1
97.0
Proinsulin-C-peptide, pmol/l
76.2
67.3
2.0
56.6
Table 2a show how many samples which fulfill the demand on allowed deviation in % for each group of tubes.
Part 2
Table 3. Deviations from”0 – sample” which allows 95.5 % of the results to fulfill goals
Component
CV %
Analytical
Critical
level
Clinical pre-analytical
deviation*
Total CV for
deviation(%)
Allowed deviation (%)
between 0 – sample and
test sample 95.5% results
within ±2 SD
Concentration
CI 95.5 %
CV %,
Glucose
0,5
6,7
0,54*
3,9
4,1
8,0
Protime/INR
3,3
2,5
0,36
5,8
7,3
14,5
Table 3: Critical level is the level at which the maximal allowed deviation is defined. Clinical acceptable pre-analytical devia-
tion (95.5% CI) is given as a concentration in reported units and as CV%. CV% analytical is the imprecision in the laborato-
ries. Total CV for deviation is the combined CV – analytical for both 0-sample and the test sample and the CV% of accepted
deviation. Maximal allowed deviation is the 95.5% CI limits for difference between 0-sample and test sample which fulfill the
goals at the critical level.
*Clinical acceptable pre-analytical deviation is an estimate
Table 3a. No. of results which fulfill the goals.
Component
No. of results which fulfill the demand on allowed deviation (%)
Second transport
First transport next day
Glucose
96,8
98,9
Protime/INR
99.0
100
Table 3a show how many samples which fulfill the demand on allowed deviation in % for each group of tubes.
Table 3a shows how many samples fulfill the demand on allowed deviation. Glucose and Protime/INR fulfill
the demand for both second transport and first transport next day.


